Conversation at CoreNet: Using Bond Math to Manage Lease Portfolios
How bond market duration can align your real estate decisions with your business strategy.


Imagine that you are a real estate consultant attending the CoreNet annual meeting. All around you are corporate real estate executives with portfolios of leases, some small, some larger, and some very large. You walk up to one of these executives and it turns out that he or she manages a portfolio of 200 leases around the US. You strike up a conversation with the following question: “Do you use any bond mathematics to help structure your portfolio?”
He or she gives you a puzzled stare.
You say: “These tools can be very useful, and useful in a way that will benefit your CFO and Treasury function.”
You have their attention. You continue: “If you are interested, there is an article I would like you to read.”
This is that article.
Setting the Table
Before we begin the analysis, we need to simulate a portfolio of leases like the one managed by our hypothetical CRE executive.
We built a synthetic portfolio of 290 leases spread across 18 US markets: New York, San Francisco, Boston, Los Angeles, Chicago, and twelve more. The distributions are calibrated to public market data (CoStar, CBRE benchmarks) but no proprietary information was used. Think of it as a controlled laboratory: we can change one variable and hold everything else fixed, which is something you can never do with a real portfolio.
The leases span three building classes (A, B, and C), with original terms ranging from three to fifteen years. Some have flat rents, some escalate at 2.5% or 3% annually. Some have free rent at commencement. It’s a messy, realistic collection.
Of the 290 leases, 201 are active, meaning they have at least three months of remaining term. The rest have already been dealt with or are in the process of winding down. Here are the basics on the active portfolio:
Total present value: $1.11 billion
Total square footage: 2.8 million
Average rent: ~$52 per square foot
Markets: The big gateway cities (New York, SF, Boston, LA) account for about 60% of the value
Average remaining lease term: 4.8 years
That last number—4.8 years—keep it in mind. We’re going to come back to it.
Now, if you squint at this portfolio, something interesting emerges. Each lease is a stream of predictable cash payments over a fixed period. The tenant pays rent (like a bond coupon). The lease has a maturity date (like a bond maturity). The creditworthiness of the tenant determines the risk of those payments (like a bond credit rating). The structural parallel between a lease and a bond is clear and correct. And it unlocks a mature analytical toolkit that fixed-income portfolio managers have been refining for decades.
One more thing before we get into the math: forty-two of these leases come up for renewal over the next two years: about five per quarter. As we’ll see, how those renewals get structured matters a lot.
The Math
Now we need to understand some basic mathematical concepts to describe and analyze our portfolio of “bonds.”
The first (and most important) concept is duration.
In bond math, duration is the weighted-average time to receive cash flows, where the weights are the present values of each payment. A simple way to think about it: if you could balance a lease’s cash flows on a fulcrum, like a seesaw, with each payment weighted by how much it’s worth in today’s dollars; the balance point is the duration.
Duration is always shorter than the remaining lease term, because earlier payments are worth more in present-value terms (they’re discounted less). And the degree of that compression depends on how long the lease is.
Take three flat leases at a 6% discount rate:
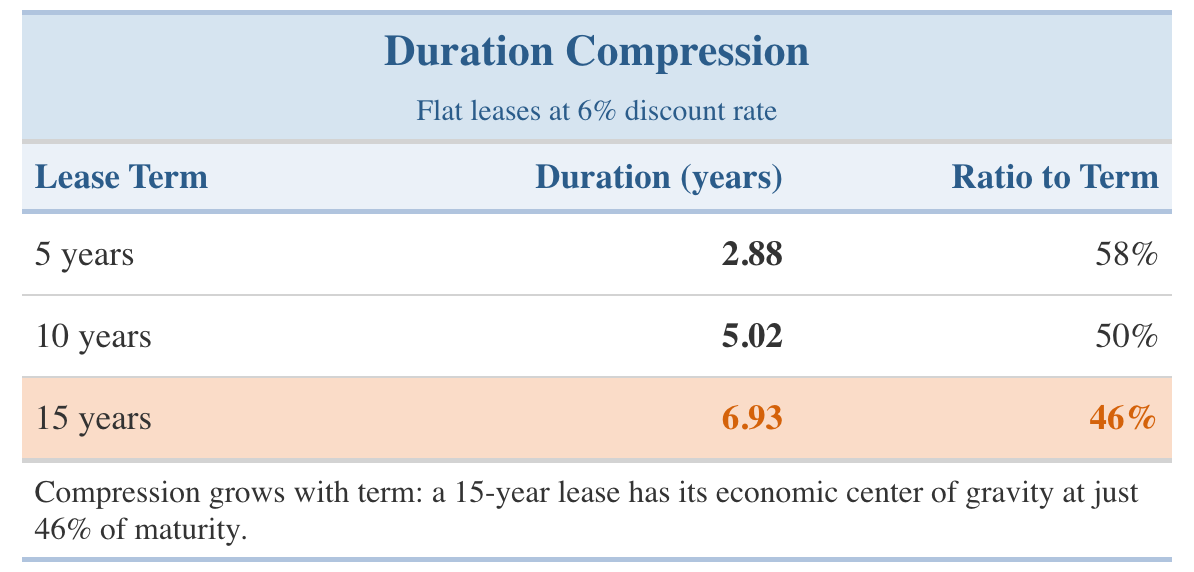
A five-year lease has its economic center of gravity at 58% of its term. A fifteen-year lease? Only 46%. The compression grows with length. This is important because it means a long lease carries proportionally more economic weight in its early years than you’d guess from the calendar.
Escalation structures nudge duration outward, but modestly: a 10-year lease with 3% annual escalation has a duration of 5.26 years instead of 5.02. The escalation pushes some economic weight toward the back end, but term length is still the dominant driver by far.
Now let’s look at the whole portfolio. Our 201 active leases have a present-value-weighted duration of 5.6 years.
Remember that 4.8-year average remaining term? Duration tells a different story: 5.6 years, not 4.8. Why? Because duration weights each lease by its present value, and the larger, more expensive leases contribute more economic weight. A 34,000-square-foot Class A lease in Midtown Manhattan counts for a lot more than a 5,000-square-foot Class C lease in Nashville. Duration captures this; a simple average doesn’t.
One important caveat: this entire analysis is based on cash flows, not accounting entries. Under ASC 842 (and IFRS 16), lease expense is recognized on a straight-line basis regardless of when the tenant actually writes the checks. A front-loaded lease and a back-loaded lease produce identical GAAP expense over the term. That’s fine for the income statement, but it erases exactly the timing information that makes duration useful. GAAP smooths the signal, which might explain why you won’t find much discussion of this concept in the literature.1
The Goal
The goal, simply stated, is to align the real estate strategy with the timing implicit in the business strategy.
Where does that business strategy timing come from?
The most explicit source is a strategic planning horizon. Many companies operate on a rolling plan: a “Plan +5” or “Plan +3” that sets the time frame for capital allocation, headcount forecasts, and operating assumptions. The CFO or head of strategy establishes the framework; every function, including real estate, operates within it.
Sometimes the timing comes from corporate finance. A large tranche of debt maturing in four years creates pressure to manage cash commitments around that date. Or a planned equity raise demands a leaner cost structure by a certain deadline.
Sometimes it emerges from a dedicated strategic study—the kind with a title like “Aligning Corporate Strategy and Our Real Estate Portfolio”—that produces a set of recommendations with a specific timeline attached.
And sometimes the timing is implicit: the degree of confidence in growth plans, the need for operational flexibility, the headcount trajectory.
However it arrives, the planning horizon gives the portfolio manager a target. And once you have a target—say, five years—you have a target duration.
Our portfolio sits at 5.6. If the planning horizon implies a target of 5.0, we have a gap of 0.6 years. Not enormous, but real. And measurable. The question is: can the portfolio manager close that gap using the tools available to her? And if so, how fast?
The Tools
The most direct lever is the deal structure of each new lease. Different structures produce different durations — and the differences are large enough to matter:
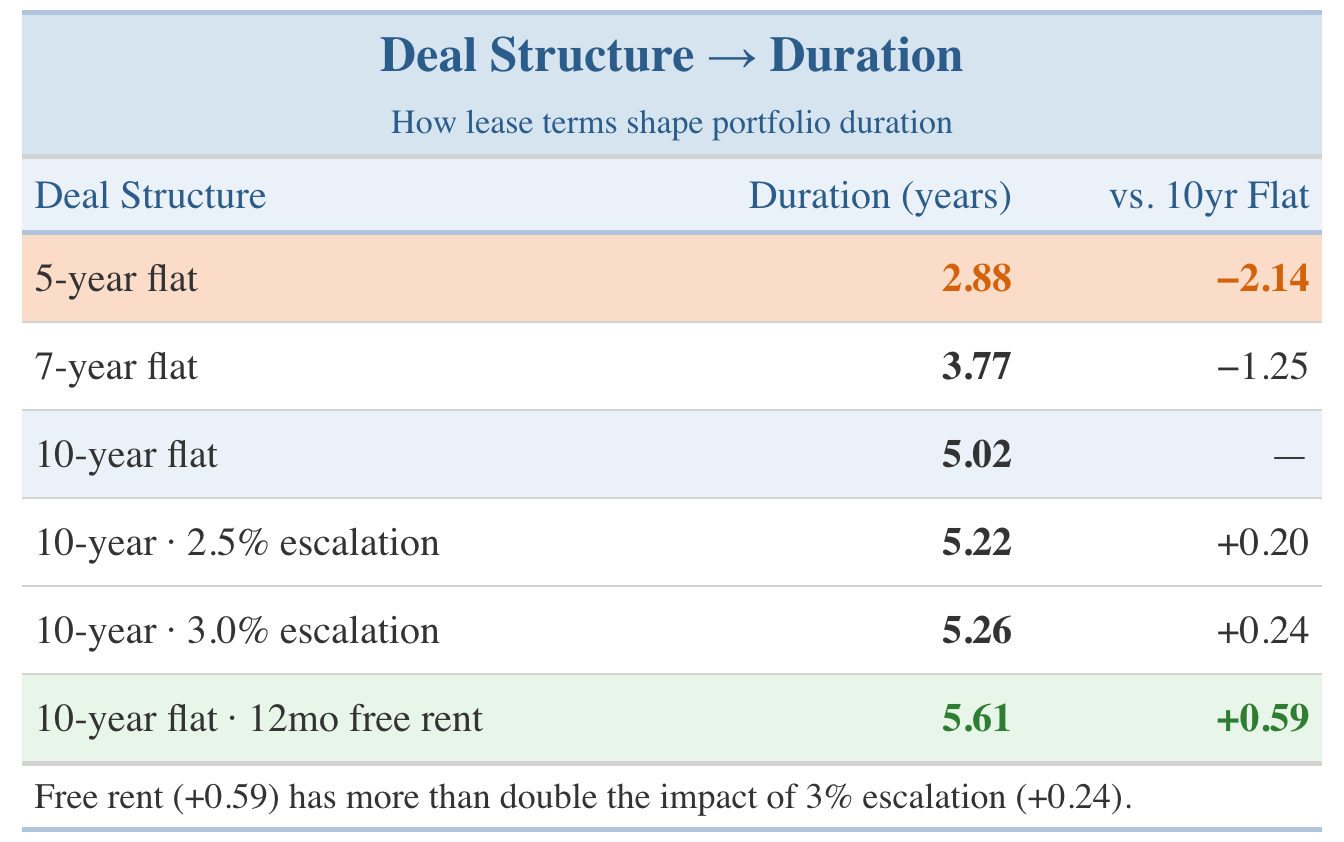
A few things jump out. Term length is the dominant lever. The spread between a 5-year and a 10-year deal is 2.14 years of duration. But free rent is surprisingly potent: 12 months of free rent on a 10-year flat deal pushes duration from 5.02 to 5.61, an increase of 0.59 years, more than double the effect of 3% annual escalation. Why? Because free rent eliminates the earliest cash flows, the ones that carry the most present-value weight and pull the balance point forward. Remove them, and the center of gravity shifts later. Escalation, by contrast, only nudges the later payments slightly higher.
This is useful at the deal level. But the real question is what happens at the portfolio level when you structure an entire pipeline of renewals with duration in mind.
We ran a simulation. Over eight quarters—two full years—our portfolio manager faces 42 lease renewals. We tested four approaches:
Autopilot: Renew every lease at 10-year flat. No thought to portfolio duration.
All Short: Renew everything at 5-year flat. Maximum shortening.
Managed: Start aggressive (5-year flat when the gap is large), then ease to 7-year flat as the portfolio approaches target.
Aggressive Managed: Similar but with sharper thresholds.
Here’s how portfolio duration evolved:
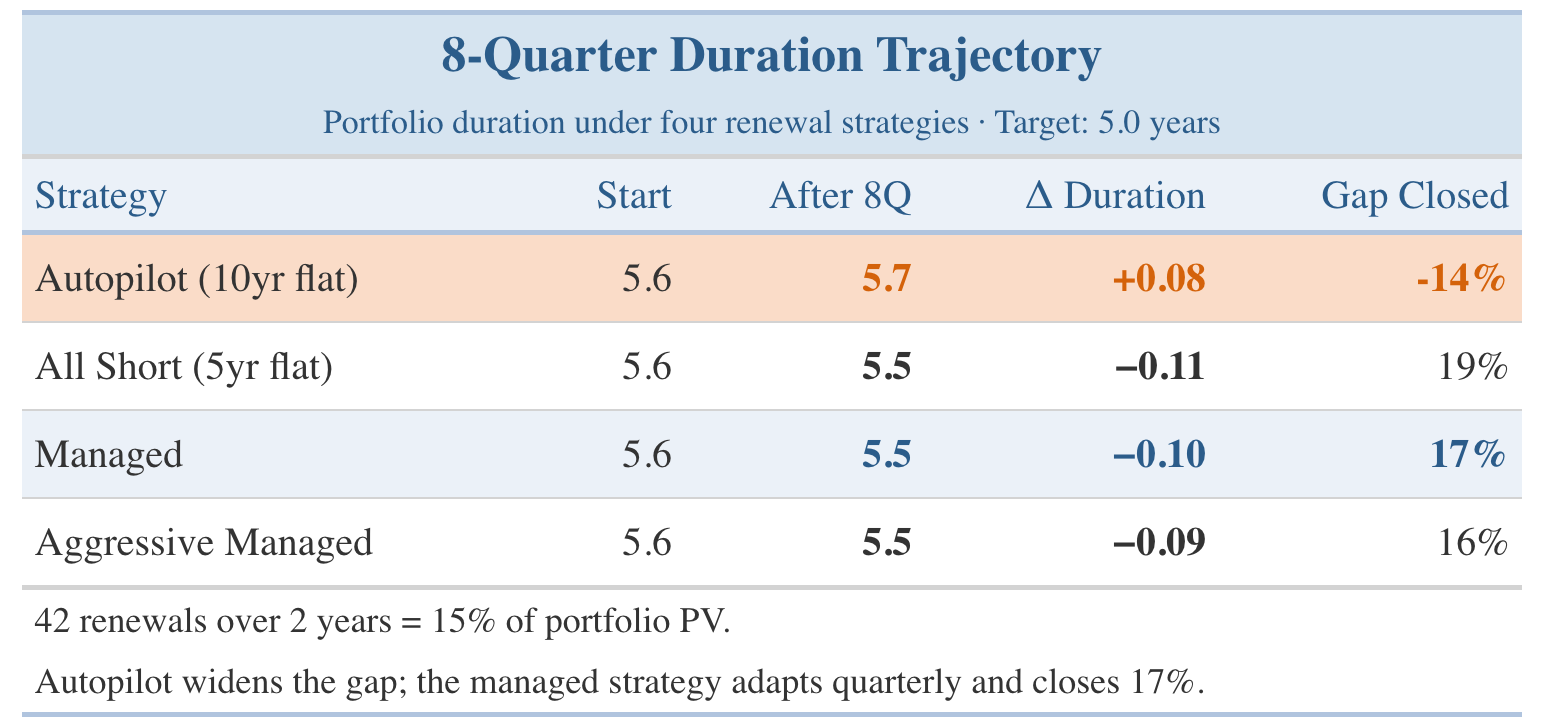
The first row is the one that matters most. If you renew every lease at 10 years without thinking about portfolio composition, duration drifts in the wrong direction. The gap to target doesn’t just fail to close — it widens. Autopilot has a cost, and now it’s measurable.
The managed strategy is more interesting. Watch how the portfolio manager’s decisions shift over the eight quarters:
Quarters 1–6: All 5-year flat renewals. The gap is large, so she pushes as short as she can. Quarter 4 produces the biggest early move, with a 28,500 SF Dallas Class A and an 18,400 SF Washington DC Class A both renewing short.
Quarters 7–8: The gap narrows below 0.50 years and the manager eases to 7-year flat deals. Quarter 7 — with seven renewals including a 16,800 SF New York Class A — produces the biggest single-quarter move: -0.02 years of portfolio duration.
Here is the key insight: duration management is a campaign, not a single-quarter fix. Those 42 renewals represent about 15% of portfolio value over two years — enough to move the needle, not enough to transform the portfolio in one pass. Each quarter’s batch of renewals is one turn of the wheel. The portfolio manager’s job isn’t to solve the equation in one batch; it’s to make sure every batch pulls in the right direction.
And the composition of each batch matters. Quarters with large gateway-market renewals—like Quarter 4’s cluster of Class A deals in Dallas, Los Angeles, and Washington DC—produce meaningful changes in portfolio duration; quarters with only small leases barely register. This tells the portfolio manager where to spend her negotiating energy. When a heavyweight renewal is on the table, the choice between a 5-year and a 10-year deal is the most consequential decision she’ll make that quarter.
One More Thing (or Two)
Duration is the main event, but a couple of other bond-market tools are worth adapting.
Rental Rate DV01 is a metric we have constructed specifically for lease portfolios, and it requires a brief explanation of why we modified the standard version.
Bond market practitioners mark their books to market continuously. A one-basis-point rise in yields changes the price of every instrument they hold, and that change is tracked in real time: it affects P&L today. Real estate portfolio managers are largely insulated from that dynamic: a rise in treasury yields does not change what your tenants owe next month. Lease cash flows are contractually fixed. No one reprices a lease portfolio when the Fed moves.
The rates that do matter—continuously, and at every renewal—are market rental rates. Every lease in the portfolio will eventually expire and reset to prevailing market conditions. The only question is when, and at what level.
So we define Rental Rate DV01 as the present value of a one-percent parallel increase in all market rents, taking effect at each lease’s expiration date. For each lease expiring T years from today, with an expected renewal term of N years:
Rent DV01ᵢ = SF × market_rent × 0.01 × annuity_factor(N, r) × (1+r)^(−T)
Summed across all 201 leases, the portfolio’s Rental Rate DV01 is $7.4 million per one-percent increase in market rents, or 0.66% of total present value. The metric has a natural shape: leases expiring within two years carry a Rent DV01-to-PV ratio of 0.89%: nearly twice the 0.40% ratio for leases with more than ten years remaining. Near-term expirations are fully exposed to the current rent environment; long-dated leases are not.
This produces a strategic inversion that the bond analogy illuminates precisely. In fixed income, rising rates hurt long-duration holders; their prices fall. In a lease portfolio, rising market rents protect long-duration holders: they are locked into below-market rates while competitors reset higher. The sign flips.
The practical implication: an occupier who shortens lease terms—gaining flexibility—simultaneously increases Rental Rate DV01. She takes on more exposure to the rental rate cycle. Whether that trade is worth making depends entirely on her view of where rents are headed, not on any abstract preference for shorter commitments. In gateway markets with structurally rising rents, locking in duration is a hedge. In secondary markets with cyclically volatile rents, flexibility has real option value.
Convexity adds one more dimension. Duration gives a linear approximation of how present value shifts with changes in discount assumptions. Convexity measures the curvature of that relationship: how quickly the linear approximation breaks down for larger moves. Think of duration as speed and convexity as acceleration. For the incremental scenario work that informs a lease negotiation, duration alone is sufficient. For stress-testing the portfolio under large shifts in rate or rent assumptions, convexity prevents systematic understatement of the exposure.
Together, duration, Rental Rate DV01, and convexity give the portfolio manager a real dashboard. When the head of real estate sits down with the CFO to discuss the upcoming renewal pipeline, she can say: “Our portfolio duration is 5.6 years against a target of 5.0. Here’s how we plan to close that gap over the next eight quarters, and here is our exposure to the rental rate market while we do it.”
That’s a conversation that didn’t exist before. And it’s worth having.
Bibliography
Amédée-Manesme, C-O., Barthélémy, F., Prigent, J-L. “The Impact of Lease Structures on Optimal Holding Period.” Journal of Real Estate Portfolio Management 20, no. 2 (2014).
Anderson, R. I., et al. “Curvature and Contingencies: Pricing Lease Term Risk.” Journal of Real Estate Finance and Economics (2025).
Brueckner, J. K. and Rosenthal, S. S. “Tenant Riskiness and the Term Structure of Commercial Leases.” Working Paper, 2022.
Fabozzi, F. J. Fixed Income Analysis. 2nd ed. Hoboken: Wiley, 2007.
Tuckman, B. and Serrat, A. Fixed Income Securities: Tools for Today’s Markets. 3rd ed. Hoboken: Wiley, 2011.
Under ASC 842, the right-of-use asset and lease liability are measured at present value on day one, but subsequent expense recognition is straight-line. Any analysis of “duration” based on GAAP expense streams would return the midpoint of the lease term every time — mathematically uninteresting and practically useless. The cash-flow approach used here preserves the timing information that accounting standards deliberately smooth away.